Sales report PDF template
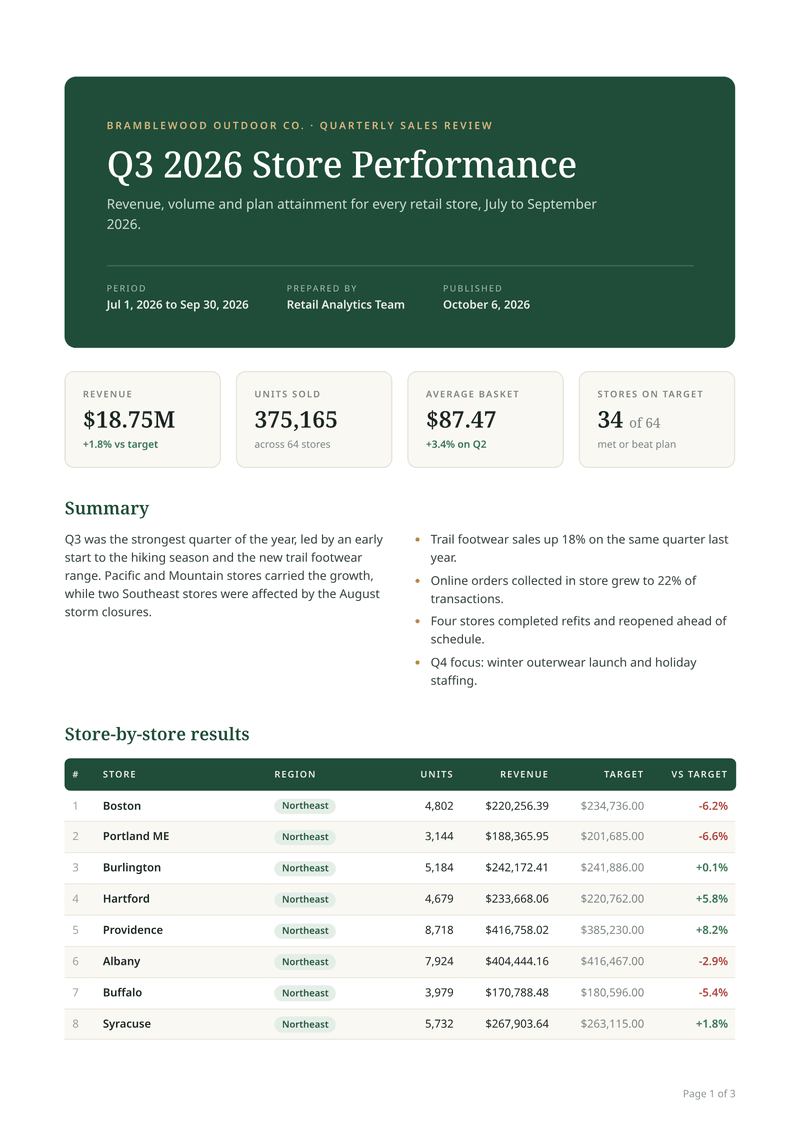
A multi-page quarterly sales report with key figures, a summary and a long results table. The table header repeats on every page, and page numbers print for you.
- A4, portrait
- 3 pages in the sample
- Free to start
What this report template is for
Use it for monthly or quarterly reports that go to managers, clients or investors. It suits retail and sales teams, agencies that report to clients, and any business that sends the same report on a schedule.
You send the raw figures for each store. The template adds up the totals, compares revenue with the target, and counts the stores on plan. The sample has 64 stores and fills three pages.
What a good sales report includes
- A clear title and the period it covers.
- A few key figures at the top, such as revenue and progress against target.
- A short summary in plain words: what went well and what did not.
- The detail, in a table that is easy to scan.
- Totals that match the detail.
- Who wrote it and when, with notes on how the figures were counted.
The fields it fills
Each field below fills one part of the sales report. Change the data and keep the design, or change both.
| Field | What it fills |
|---|---|
| General | |
company | Your company name. |
currency | Currency for every amount, such as USD. |
locale | How numbers and dates are written, such as en-US. |
| Report | |
report.kind | The kind of report, shown above the title. |
report.title | The report title. |
report.subtitle | One line on what it covers. |
report.period_start | The first day of the period. |
report.period_end | The last day of the period. |
report.author | Who wrote it. |
report.published | The date it was published. |
report.footnote | A note on how figures were counted. |
| Summary | |
summary.transactions | The number of sales, for the average basket. |
summary.basket_growth | Change in the average basket, in percent. |
summary.intro | A short summary in plain words. |
summary.highlights[] | A few bullet points. |
| Stores | |
stores[].store | The store name. |
stores[].region | The region it belongs to. |
stores[].units | Units sold. |
stores[].revenue | Revenue for the period. |
stores[].target | The revenue target. |
How to make your sales report PDF
Two ways to get your sales report: try it in the dashboard, then connect your app when you are ready.
Without code: the dashboard
- 1Sign up free. You don’t need a card.
- 2Pick the sales report template.
- 3Put your own details into the sales report’s sample data, and change the words and colours.
- 4Watch the free preview as you type. It carries a “CASTPDF TEST” watermark.
- 5Verify your email and press Generate PDF for a clean copy. It counts as one PDF on your plan.
To make each sales report from your own app instead, send your data with a live key, as shown here.
For developers: one request
Copy the template ID from the editor. Save your sales report data in a file with that ID, then send it in one request. The reply is the finished PDF.
curl https://api.castpdf.com/v1/pdf \
  -H "Authorization: Bearer $CASTPDF_API_KEY" \
  -H "Content-Type: application/json" \
  -d @request.json \
--output report.pdf{
"template_id": "YOUR_TEMPLATE_ID",
"data": {
"company": "Bramblewood Outdoor Co.",
"currency": "USD",
"locale": "en-US",
"report": {
"kind": "Quarterly sales review",
"title": "Q3 2026 Store Performance",
"subtitle": "Revenue, volume and plan attainment for every retail store, July to September 2026.",
"period_start": "2026-07-01",
"period_end": "2026-09-30",
"author": "Retail Analytics Team",
"published": "2026-10-06",
"footnote": "Revenue is net of returns and discounts, in US dollars. Targets are the Q3 plan approved in June 2026."
},
"summary": {
"transactions": 214380,
"basket_growth": 3.4,
"intro": "Q3 was the strongest quarter of the year, led by an early start to the hiking season and the new trail footwear range. Pacific and Mountain stores carried the growth, while two Southeast stores were affected by the August storm closures.",
"highlights": [
"Trail footwear sales up 18% on the same quarter last year.",
"Online orders collected in store grew to 22% of transactions.",
"Four stores completed refits and reopened ahead of schedule.",
"Q4 focus: winter outerwear launch and holiday staffing."
]
},
"stores": [
{
"store": "Boston",
"region": "Northeast",
"units": 4802,
"revenue": 220256.39,
"target": 234736
},
{
"store": "Portland ME",
"region": "Northeast",
"units": 3144,
"revenue": 188365.95,
"target": 201685
},
{
"store": "Burlington",
"region": "Northeast",
"units": 5184,
"revenue": 242172.41,
"target": 241886
}
]
}
}The full sample has 64 stores. Three are shown here to keep it short.
Make it yours
- Rename the columns, or add your own, such as margin or returns.
- Add charts as images, or draw them in the template.
- Change the colours, the fonts and the text at the top of each page.
- Group the table by region, team or product, whichever fits your business.
- Every save is a new version, and your last 50 versions are kept.
Built for long reports
Long tables are where many PDF tools struggle. In this template the table header repeats at the top of every page, so each page makes sense on its own.
From page two, the report title runs along the top. “Page 2 of 3” prints at the bottom of every page. Page breaks fall between rows where possible.
Questions about sales report PDFs
What should a sales report include?
How do I repeat the table header on every page of a PDF?
How do I add page numbers to a PDF report?
How do I automate a monthly or weekly report?
Why do table rows split across pages, and how do I stop it?
Can I add charts?
Related templates

Certificate
A4, landscapeReward people who finish a course, with their name and date.
Make your first sales report PDF
Sign up free, pick the sales report template and make it yours. The Free plan includes 100 PDFs a month, and you don’t need a card.