Who automates reports this way
Any business that sends the same report again and again, to readers who would rather open a PDF than log in to a dashboard. Three typical cases:
- A weekly sales report. The operations lead of a retail chain wants every store’s numbers in her inbox by Monday at eight. A job pulls last week’s sales from the database and turns them into one PDF with a row per store.
- A monthly agency client report. A marketing agency reports to twenty clients from the same layout. Each client gets its own figures, its own name on the cover and its own summary, without anyone copying numbers into slides.
- A quarterly board pack. A finance lead sends directors a cover page, a handful of headline figures, a written summary and detailed tables in an appendix. Directors print it and write on it, so page numbers matter.
In all three, the data already lives in your own systems. The slow part is turning it into something people can read, file and forward. That is the part a report API takes over.
What makes a report worth reading
A report is read in a hurry, often on paper, often one page at a time. Build it for that reader:
- The answer on page one. Put the two or three numbers people ask about first, before any table. Most readers stop there.
- Something to compare against. A figure alone says little. Show it next to a target, the previous period or the same period last year.
- Pages that stand on their own. People print page 3 and hand it to a colleague. Each page should carry the report title, its page number and the column names of the table it shows.
- A clear cut-off. State the period and when the data was taken, so nobody argues about a late order that arrived after the report ran.
- Definitions in one line. Say whether revenue is net of returns, which currency you use and where targets came from. A footnote is enough.
- A name to ask. Readers with a question should know who prepared the numbers.
Board packs lean towards fewer numbers and more words. Operations reports lean the other way, with long tables people scan for their own row. One template can serve both if you keep the headline figures and the detail in separate blocks.
What the report starter works out for you
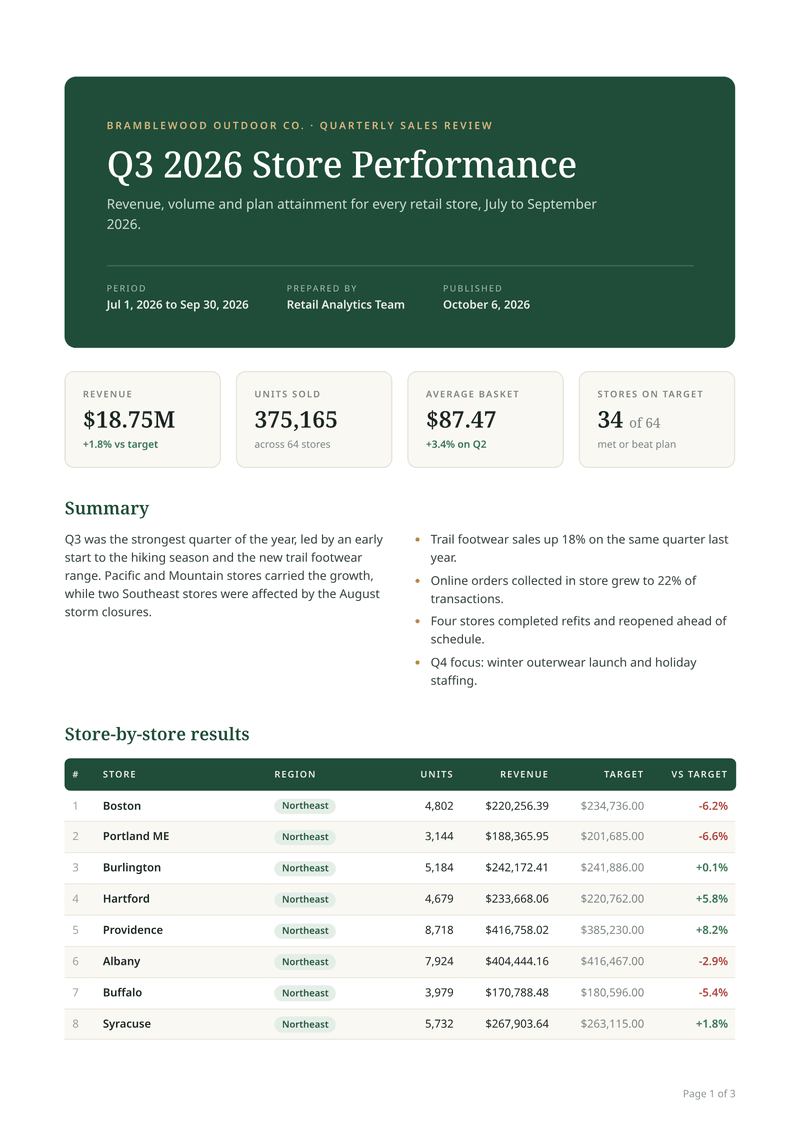
The report starter is a quarterly store review, but the pattern fits any report with a list of rows. You send the raw rows and a few labels. The template does the arithmetic, so the totals on the cover always match the table.
| You send | The template prints |
|---|---|
| Revenue and target for each store | Total revenue, the gap to target in percent, and a green or red figure for each row |
| Units sold per store | Total units across every store |
| The number of transactions | The average basket, as total revenue divided by transactions |
| The list of stores | How many stores met or beat their target, out of how many |
| A currency code and a locale | Every amount and number written the local way, such as $1,234.50 or 1.234,50 € |
You can rename the columns, swap stores for clients or products, and add fields of your own in the editor. While you design, Simple mode lets anyone change the sample figures in a form and watch the preview update, with no code.
Run it on a schedule
CastPDF does not run schedules or send email. Your own scheduler does that, whether it is cron, a scheduled cloud function or a job queue. CastPDF does the one hard step in the middle: turning data into a well-paginated PDF.
- Make the starter yours. Sign up free, pick the report starter, and change the title, colours, columns and footnote in the editor. Save it and copy its template ID.
- Write the query once. Shape your database query so it returns one object per row, with the same field names as the sample data further down this page.
- Call the API from your scheduled job. Send
template_idanddatatoPOST /v1/pdf. Use the report period as theIdempotency-Key, such assales-report-2026-W41, so a retried job never makes a second report. - Deliver the result. Ask for
"response": "url"and put the signed link in your email or chat message, or ask for the file and save it in your own storage.
const week = '2026-W41';
const stores = await loadStoreResults(week); // your own database query

const res = await fetch('https://api.castpdf.com/v1/pdf', {
  method: 'POST',
  headers: {
    Authorization: `Bearer ${process.env.CASTPDF_API_KEY}`,
    'Content-Type': 'application/json',
    'Idempotency-Key': `sales-report-${week}`,
  },
  body: JSON.stringify({
    template_id: process.env.REPORT_TEMPLATE_ID,
    data: {
      company: 'Bramblewood Outdoor Co.',
      currency: 'USD',
      locale: 'en-US',
      report: { kind: 'Weekly sales', title: `Week ${week.slice(6)} store results` },
      summary: { transactions: 51240, basket_growth: 1.2, intro: 'A quiet week before the autumn sale.', highlights: [] },
      stores,
    },
    filename: `sales-report-${week}.pdf`,
    response: 'url',
  }),
});

if (!res.ok) throw new Error(`CastPDF error ${res.status}: ${await res.text()}`);
const { url, pages } = await res.json();
await emailManagers(url, pages); // your own mailer
The example trims the report and summary objects to a few fields; send every field your template prints. For a client report, loop over your clients and put the client ID and the month in each key, such as client-118-2026-09. The Node.js guide covers timeouts and retries in more depth.
Long reports, handled
Reports are where page breaks go wrong in most HTML to PDF setups. Here is what the report starter does in print mode, checked against its own code:
- Sixty rows and more. The sample has 64 stores and fills three pages. When the table continues on a new page, its header row and column widths repeat at the top, and no row is cut in half.
- Page numbers. Every page carries "Page 2 of 3" in the bottom right corner. The numbers come from a page margin rule in the CSS, so they stay right when the row count changes.
- A running header. From page two, the report title runs along the top left, taken from the cover heading itself. A fixed label sits on the right, "Internal: not for distribution" in the sample, and you can change it. The first page has no header at all.
- Summary boxes kept whole. The headline figures and the written summary carry the
keep-togetherclass. If they do not fit at the bottom of a page, they move to the next page as one block instead of splitting. - Charts. CastPDF has no chart helper. Draw the chart in your own code as a PNG or an SVG. Send it as a public link or a
data:URL for an image tag, or as SVG markup printed with therawfilter. In print mode, an image taller than a page is scaled down to fit. - The page limit. One document can have up to 50 pages. A longer report fails with
document_too_largeand is not counted. Split it into one PDF per region or per month instead. - Missing targets. A store with a target of zero gives a meaningless percentage. Leave such rows out of the data, or give them a placeholder target and say so in the footnote.
Read the guides on repeating table headers and page numbers to reuse these rules in a report you design from scratch.
Other report shapes
- Grouped tables. Sort rows by region or team in your query and add a heading row each time the group changes. The repeating header still works.
- Several tables. Put a sales table, a stock table and a staffing table one after another. Each one repeats its own header when it runs onto a new page.
- Letter paper. Switch the page format in the template settings for readers in the US. The layout adapts, and the margin boxes move with it.
See every field and a full preview on the report template page. A report counts as one PDF however many pages it has, test PDFs are free and watermarked, and the Free plan includes 100 live PDFs a month.
The data it needs, and one request
This is the real sample data of the sales report template. Save your template in the dashboard, copy its ID, and send data in this shape. The reply is the finished PDF.
curl https://api.castpdf.com/v1/pdf \
  -H "Authorization: Bearer $CASTPDF_API_KEY" \
  -H "Content-Type: application/json" \
  -d @request.json \
--output report.pdf{
"template_id": "YOUR_TEMPLATE_ID",
"data": {
"company": "Bramblewood Outdoor Co.",
"currency": "USD",
"locale": "en-US",
"report": {
"kind": "Quarterly sales review",
"title": "Q3 2026 Store Performance",
"subtitle": "Revenue, volume and plan attainment for every retail store, July to September 2026.",
"period_start": "2026-07-01",
"period_end": "2026-09-30",
"author": "Retail Analytics Team",
"published": "2026-10-06",
"footnote": "Revenue is net of returns and discounts, in US dollars. Targets are the Q3 plan approved in June 2026."
},
"summary": {
"transactions": 214380,
"basket_growth": 3.4,
"intro": "Q3 was the strongest quarter of the year, led by an early start to the hiking season and the new trail footwear range. Pacific and Mountain stores carried the growth, while two Southeast stores were affected by the August storm closures.",
"highlights": [
"Trail footwear sales up 18% on the same quarter last year.",
"Online orders collected in store grew to 22% of transactions.",
"Four stores completed refits and reopened ahead of schedule.",
"Q4 focus: winter outerwear launch and holiday staffing."
]
},
"stores": [
{
"store": "Boston",
"region": "Northeast",
"units": 4802,
"revenue": 220256.39,
"target": 234736
},
{
"store": "Portland ME",
"region": "Northeast",
"units": 3144,
"revenue": 188365.95,
"target": 201685
},
{
"store": "Burlington",
"region": "Northeast",
"units": 5184,
"revenue": 242172.41,
"target": 241886
}
]
}
}